SocialPond

Things about society.

Wednesday, December 06, 2017

Adult College Enrollment - IPEDS data


As described in my previous articles, I have been working on importing all IPEDS (Integrated Postsecondary Education Data System) data into my database. After spending years on this project, I was able to import about 15 years' worth of IPEDS into the database with verification. There are still few files that, without major efforts, would be hard to handle properly - these are basically long lines with embedded new line characters in the line.

That being said, I was eager to run a test case with these IPEDS data. As the fate has presented itself, my previous articles were about adult college enrollment, and it happens that the college enrollment can be approximated from the IPEDS enrollment data.


For this article, the IPEDS fall (semester) enrollment data were first examined via my R interface code, which allows searching and checking definitions across data years. In this particular case, the R code reveals that, at 2009, the 'first professional' enrollment level disappeared from the level definition. By examining the IPEDS documentation, it is verified that from 2009 and on, the  first professional enrollment is to be reported in the graduate enrollment level. Since I am a kind of familiar with the IPEDS data collection, I knew the enrollment age data were not mandatory for even-number years. If not, a quick R code that checking the total for each year should have revealed that.

Since in IPEDS, data were only tagged with college id (unitid), extra steps were needed to tag the data with attributes from the college. These attributes are made available through the so called 'Institutional Chararcteristic' survey. Whit this survey, colleges can be tagged with control (Public/Private), level (4 or 2 year college), location (state/address...). For this project, it was found that, in 2011, there were 3 institutions did not reported appropriate information for the 'institutional characteristic' survey. Luckily, two of them were available from other years. To preserve most data, we fixed the two with info from other year and coded the third one with special code so that we can include them if we so desire. For this article, we include all institutions that were collected by IPEDS and this include institutions that located on US territories and miscellaneous islands. To list a few, this includes AS (America Samoa), GU (Guam), PR (Puerto Rico), MH (Marshall Island) ... etc.


With previous adult college enrollment article in mind, under-graduate enrollment from the IPEDS was considered a better approximation to those from the ACS data.


Examining the IPEDS age data, it is noticed that not all data were collected with equal age span. For example, data are collected with age categories like 18 to 19, 22 to 24, 25 to 29 ... etc. Presenting age data directly with with these age categories results in the following chart and the chart can trick reader to think that there is a bump in the age distribution which sure not look like the age distribution presented in my previous article.

Age distribution using IPEDS age categories

A better approach to resolve this would be using the average head count for each age category instead. Better yet, you can assign the average to each age in the category to provide a better representation in terms of age axis.

In this article, an average assigned to the category is used. To approaching the college enrollment data in my previous ACS based article, we presented the age distribution with the total enrollment, the sum of both full-time and part-time students. As shown in the following graph, it can be seen that the curve exhibits a familiar monotonic decreases after the primary peak around college graduation.

Age distribution for total fall enrollment using average for each age category

Since the IPEDS data also allow the separation of data with full-time, and part-time, it is worth the efforts to examine these characters too. The overall (sum over states) full-time distribution can be seen in the chart below.
Age distribution for full-time fall college enrollment using average for each age category

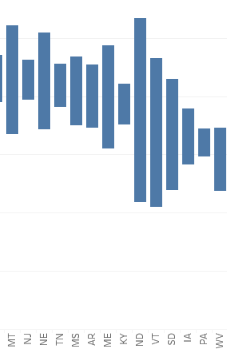
A typical age distribution for a state (NE) can be seen below. For most state, the only difference is whether the age group 18 to 19 or the age group 20 to 22 is the highest. The full-time fall enrollment age distribution for Utah, however, show a very different distribution - see chart below. This may related to the Mormon missionary program but more evidence from other survey or data elements may be needed.
A typical state (NE) age distribution for full-time enrollment using average for each category

Full-Time fall enrollment age distribution for the state of Utah
The IPEDS universal total for part-time fall enrollment can be seen in the chart below. Comparing to full-time and total enrollment, it clearly show a distinctive age distribution. For some states, their part-time fall enrollment are similar to that of the IPEDS universal total as shown below (NE). There are, however, another set of states (e.g. CA, FL, GA, ... etc.) that shows a quite different age distribution pattern. Part-time students in these states seem to take a break from school (to work?) and come back to enroll in school later.
IPEDS universal age distribution for part-time fall enrollment

Part-Time fall enrollment for the State of Nebraska

Part-Time fall enrollment for the State of California

Examining the IPEDS universe part-time enrollment, trending by years, we noticed that there were more younger kids in recent years. By presenting these same data in percentages, it shows that, proportionally, elder adult were taking smaller share of the part-time enrollment in recent years.
Age distribution of part-time students in percents

Updated 20180525: A Kickstarter project has been created that will allow average data user to obtain these kind of IPEDS data.

Labels: , , , , , , , , , , ,

Tuesday, November 28, 2017

Education Enrollment and Adult College Enrollment by Age - 2016 ACS

In my previous article, we look at the total adult college enrollment for each state. In this, I would like to take one step further to look into the enrollment by age. In this article, ages are presented in an interval of 3. An age label of 25 is actually the sum of age 24, 25, and 26.

Again, the analysis is post on my public tableau website.

The first chart presents few basic numbers that provided background information for discussion. In the chart, the variable zTtl represents the total population. When select all states, the Millennial's bump at age 25 can clearly be seen. The curve zAttnmntUndr+ represent all people with education attainment of undergraduate degree (associate or bachelor) or above. As shown in the chart, the curve first take a large gain at age 25 when most college students obtained their undergraduate degrees. The curve then peaked at age 31 when few more students finishing their undergraduate degrees and others obtained their graduate degrees. However, keep in mind that, in this age chart, the total population trend also contributes.
Education Attainment and Enrollment by Age - United States ACS 2016

The line zAttnmntNoCllgDgr represents the number of people do not obtained undergraduate degree or above. As can be seen in the chart, the line begins to drop once students begin to obtain their undergraduate degrees. Again, keep in mind, the population trend has its effect as show in the bump around age 55, where, due to the population bump,  the population do not have college degree also show a bump. The remaining two green-blueish lines display the college undergraduate (zEnrllUndr) and graduate (zEnrllGrdt) enrollment. These two lines peaked at age 19 and 25 respectively.


The second chart provide basic information on college-education attainment by age for each state. The variable zpctAttnmntUndr+ shows the percent of population obtained undergraduate degree and above. With all states selected, the United States shows a highest rate of 46% at the age of 34. The other two lines on this chart, zpctAttnmntUndr and zpctAttnmntGrdt, represent the percent of population with the highest degree attainment of undergraduate or graduate degrees.

Education Attainment By Age - United States ACS 2016

The third chart displays two education attainment lines from the first chart (zAttnmntUndr+, and zAttnmntNoCllgDgr) along with a college enrollment line (zNoUndrEnrllUndr+). The college enrollment line counts all students enrolled in both undergraduate and graduate but haven't obtain an undergraduate degree yet. By taking the ratio of zNoUndrEnrllUndr+ against zAttnmntNoCllgDgr we arrived at the forth chart.
Education Attainment and Enrollment By Age - United States ACS 2016

As mentioned above, the forth chart display the ratio between zNoUndrEnrllUndr+ and zAttnmntNoCllgDgr. It shows the fraction of non-college degree earner enrolled in college classes. Conferred to chart three, since at the age of 18, 19, and 20, there were relatively few people (313,517) obtained college degrees, the peak at the age 19 shows that, in US, about 50% of that age group went to college. Also observed on the chart is that, after the peak, the percentage of non-college-degree bearer enrolled in college decreased monotonically. Meaning that the older the people are, the less likely they will enrolled as an adult student. For Adult college enrollment at age 25 (aggregates age 24,25, and 26), the rate are about 15% nationally, and dropped fast to 9% at age 28 ( aggregates 27, 28, and 29).

Non-Degree Bearer Enrollment By Age - United States ACS 2016

Labels: , , , , , , , , ,

Saturday, November 18, 2017

A Look At the Adult College Enrollment by State - 2016 ACS

After importing the ACS (American Community Survey) 2016 1-Year PUMS (Public Use Micro Sample) data, the question is what come next? Just holding to sets of data doesn't do anyone any good except taking up disk spaces - in this case, it takes about 2.9GB including both the personal and housing unit data.

With the push of Obama's call for increasing college attainment of 60% by 2020, the adult college enrollment can be an important factor. * Obama, however, did not limited his view to associated degree and above. Researchers have been trying to include all sorts of certificates on their way to compare to the 60% goal.

In this article, we try to measure what percentage of the adult who had not obtained an undergraduate degree is enrolled in college. We defined the adult as anyone who is 25 years old or older. This approach, basically give the traditional high school graduates 6 years to obtain their undergraduate degree before been considered in our measure.

As would be presented in a separate article, our definition of 'adult college enrollment' may not match that mental picture of some of our readers since some reader may only consider individuals that rejoin the college after years of absent as the 'adult college enrollment'. While with our definition, traditional students taking longer than 6 years to obtain their first college are included.

Our result of processing the 2016 ACS 1-Year PUMS is presented at Tableau's public use web site.

In the first chart, we presented three numbers that were used for each state. The first number, NoUndrDgr, is the number of adults 25 years old or older that did not obtained an undergraduate degree (associates or bachelor) yet.The second number, WorkOnUndrDgr, for a state is the number of adults that were defined in the first number that are enrolled in undergraduate college programs. The third number, WorkOnGrdtDgr, for a state is the number of adult that were defined in the first number that are enrolled in college graduate program. Even though traditional wisdom doesn't think the third number is possible, for some states these numbers are perceivable. One possible case is due to medical schools. Because some medical school only require appropriate undergraduate course work and standard testing results to be qualified as applicants, it become possible for these students to enrolled in graduate medical program before obtaining bachelor degree. The other possibilities become possible since some colleges begin to thread bachelor degree and the graduate degree together so that students are enrolled for graduate degree while work toward finishing up bachelor degree with courses that credited for both degree. There were cases, the students will be awarded both degree at the end of the program and resulting graduate school enrollment before finishing up bachelor degree.

The Number for Adult College Enrollment


In the second chart we present the percent of students who were 25 years old or older that had no received an undergraduate degree that are enrolled in college undergraduate program. The chart is intended to rank the states based on the percent of adult college enrollment for adult of 25 years old or older that had not obtained their first undergraduate degree. In this chart, we ignored the third number presented in the first chart just to keep the definition clearer and consider those third number exception cases. The second chart also display the 90% MOE, which represent the range of possible sampling errors.


Adult College Enrollment Rate with 90% MOE

The third chart presents the Adult College Enrollment Rate in the map format.
Adult College Enrollment Rate by States

The forth chart provide the number in a table format and allows user to easily compare selected states. 
Table for Comparing Selected States

The following table lists all states in ranking order.

ST% Enrolled90% MOE
UT3.9%0.4%
HI3.8%0.6%
CA3.7%0.1%
DC3.6%1.0%
NM3.4%0.5%
AK3.4%0.8%
RI3.3%0.5%
WA3.2%0.2%
MD3.1%0.3%
CO3.1%0.3%
VA3.0%0.2%
AZ3.0%0.2%
OR3.0%0.3%
GA3.0%0.2%
NC2.9%0.2%
TX2.9%0.1%
NV2.8%0.3%
ID2.7%0.5%
DE2.7%0.6%
CT2.7%0.3%
KS2.7%0.3%
MN2.6%0.3%
MI2.6%0.2%
SC2.5%0.2%
WY2.5%0.7%
MA2.5%0.2%
FL2.5%0.1%
WI2.4%0.2%
NH2.4%0.4%
IL2.4%0.2%
LA2.4%0.2%
OH2.3%0.2%
NY2.3%0.1%
IN2.3%0.2%
OK2.2%0.3%
MO2.2%0.2%
AL2.1%0.2%
MT2.1%0.5%
NJ2.1%0.2%
NE2.1%0.4%
TN2.1%0.2%
MS2.0%0.3%
AR2.0%0.3%
ME2.0%0.4%
KY1.9%0.2%
ND1.9%0.8%
VT1.7%0.6%
SD1.7%0.5%
IA1.7%0.2%
PA1.6%0.1%
WV1.5%0.3%

Labels: , , , , , , ,