SocialPond

Things about society.

Sunday, January 28, 2018

Population migration derived from ACS 2011 5-year PUMS dataset


This is data release of working-age-population migration based on the ACS 2011 5-year PUMS. This article provides the same info as in my previous article Population migration derived from ACS 2011 5-year PUMS dataset.

The released spreadsheet table shows the population migration moved from each US State or foreign country into each US State, including in-state moves. It is to be emphasized that since these are based on sampling, the number is for references only. To get a sense of  possible errors, the MOE should be consulted. The spreadsheet can be accessed via Google Drive.

As an example, the spreadsheet show that, from 2007 to 2011, on average, there are about 46, 117, and 15 people per year with doctoral degree moved into Nebraska from France, China, and Jamaica respectively.

Labels: , , , , , , , , , , , ,

Tuesday, January 23, 2018

Educational Attainment of Nebraska's Working Age Population via 2016-12 ACS PUMS


20180504 Update: This is a data set that is prepared explicitly for Nebraska Coordinating Commission for Postsecondary Education (Nebraska CCPE) so that they can proceed with their 2018 Progress Report. The reason for this note is  to increase the chance so people can find the data because CCPE refused to cite this web article as the source of the data


This is a data release for Nebraska's working age population.  The working age is defined as 22 to 64 inclusive. The data is based on the PUMS (Public Use Micro Sample) data released by the US Census' American Community Survey.

The table below presented the number of people with various educational attainment with the age between 22 and 64.

Ed. AttainmentPopulationLow(90%MOE)Hi(90%MOE)Percent
1. LssHsDgr87,69185,03490,3488.5%
2. HsDgrEqv241,063236,468245,65823.4%
3. SomeCllg250,798245,393256,20324.4%
4. AssctDgr116,124112,680119,56811.3%
5. BchlrDgr234,181228,870239,49222.7%
6. Mstr71,87469,33674,4127.0%
7. FP16,80615,64117,9711.6%
8. Drs11,30910,23012,3881.1%

Detailed data with sampling weights can be download from here located in Google Drive. The weights can allow users to aggregate the presented educational attainment levels.

Labels: , , , , , , , , , ,

Migration of Nebraska Working Age Population via 2016-12 ACS PUMS


20180504 Update: This is a data set that is prepared explicitly for Nebraska Coordinating Commission for Postsecondary Education (Nebraska CCPE) so that they can proceed with their 2018 Progress Report. The reason for this note is  to increase the chance so people can find the data because CCPE refused to cite this web article as the source of the data

This is a data release concerning Nebraska's working age population. The working age is defined as 22 to 64 years old, inclusive.

The table below shows the estimated net number of people that moved into Nebraska per year between 2012 and 2016 with age between 22 and 64.

Ed. AttainmentNet (In) MigrationLow(90%MOE)Hi(90%MOE)
1. No HS Dgr-203-1056650
2. HS Graduated447-6801574
3. Some College294-11111699
4. Associate Dgr366-5451277
5. Bachelor Dgr-953-2253347
6. Graduate Dgr-637-1547273
* 20180124 Number verified.
Detailed data with sampling weights can be download from Google drive at here.


.

Labels: , , , , , , , , , ,

Wednesday, December 13, 2017

Migration of Nebraska Working Age Population via 2011-07 ACS PUMS


20180504 Update: This is a data set that is prepared explicitly for Nebraska Coordinating Commission for Postsecondary Education (Nebraska CCPE) so that they can proceed with their 2018 Progress Report. The reason for this note is  to increase the chance so people can find the data because CCPE refused to cite this web article as the source of the data

This is simply a release of migration data for Nebraska working age population based on the ACS (American Community Survey) 2011-2007 5-year PUMS (Public Use Microdata Sample) data released by US Census Bureau.

Last year, after publishing the serials of articles about the population migration in the US, I re-examined what I did and spent times in revise the approach using more R codes than manually preparing and running SQL queries. This year, after comparing my R process for 2015-2011 and 2010-2006, I decide to restructure the R codes in an attempt to extract most of the common code to be shared and, hopefully, it will reduce the time spend in maintaining the code in the future. I intended to create R code to replace last year's process for education attainment too.

For this data release, the working age is defined as 22 to 64, inclusive.

Education DegreeNet (In) Migration90% MOEPossible Range
1. No High School Diploma2,1301,037.31092 to 3167
2. Has High School Diploma351,247.1-1213 to 1282
3. Some College Exp. - No Degree1,5011,493.27 to 2994
4. Associate's Degree153824.8-672 to 977
5. Bachelor's Degree891,260.9-1172 to 1349
6. Graduate Degree-1,733935.0-2669 to -798

As can be seen from the above table, for every year during that five-years period, there are, in net, estimated 1,733 people with graduate degree moved out of Nebraska. Since the number is derived from sampling, with 90% of certainty, the true number can lie between 2,669 and 798. So it is very likely (90% certainty) that Nebraska loses about 2,669 to 798 people with graduate degree every year during the five year period.

For population with bachelor degree, the net migration pattern isn't as clear cut as those with graduate degree since, with 90% certainty, the net can vary from 1,172 moving out to 1,349 moving in.


The released data file can be accessed here through Google Drive. The released data includes all weights that is needed to combine education categories if so desired. For data concerning other states, please follow this link.


Related articles: 
Nebraska Brain Drain Migration and Ed. Attainment, 2015 United States ACS 

Labels: , , , , , , , , ,

Saturday, November 18, 2017

A Look At the Adult College Enrollment by State - 2016 ACS

After importing the ACS (American Community Survey) 2016 1-Year PUMS (Public Use Micro Sample) data, the question is what come next? Just holding to sets of data doesn't do anyone any good except taking up disk spaces - in this case, it takes about 2.9GB including both the personal and housing unit data.

With the push of Obama's call for increasing college attainment of 60% by 2020, the adult college enrollment can be an important factor. * Obama, however, did not limited his view to associated degree and above. Researchers have been trying to include all sorts of certificates on their way to compare to the 60% goal.

In this article, we try to measure what percentage of the adult who had not obtained an undergraduate degree is enrolled in college. We defined the adult as anyone who is 25 years old or older. This approach, basically give the traditional high school graduates 6 years to obtain their undergraduate degree before been considered in our measure.

As would be presented in a separate article, our definition of 'adult college enrollment' may not match that mental picture of some of our readers since some reader may only consider individuals that rejoin the college after years of absent as the 'adult college enrollment'. While with our definition, traditional students taking longer than 6 years to obtain their first college are included.

Our result of processing the 2016 ACS 1-Year PUMS is presented at Tableau's public use web site.

In the first chart, we presented three numbers that were used for each state. The first number, NoUndrDgr, is the number of adults 25 years old or older that did not obtained an undergraduate degree (associates or bachelor) yet.The second number, WorkOnUndrDgr, for a state is the number of adults that were defined in the first number that are enrolled in undergraduate college programs. The third number, WorkOnGrdtDgr, for a state is the number of adult that were defined in the first number that are enrolled in college graduate program. Even though traditional wisdom doesn't think the third number is possible, for some states these numbers are perceivable. One possible case is due to medical schools. Because some medical school only require appropriate undergraduate course work and standard testing results to be qualified as applicants, it become possible for these students to enrolled in graduate medical program before obtaining bachelor degree. The other possibilities become possible since some colleges begin to thread bachelor degree and the graduate degree together so that students are enrolled for graduate degree while work toward finishing up bachelor degree with courses that credited for both degree. There were cases, the students will be awarded both degree at the end of the program and resulting graduate school enrollment before finishing up bachelor degree.

The Number for Adult College Enrollment


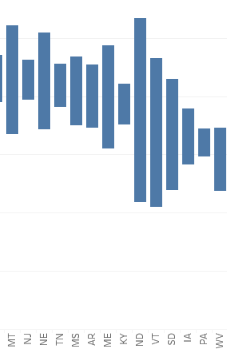
In the second chart we present the percent of students who were 25 years old or older that had no received an undergraduate degree that are enrolled in college undergraduate program. The chart is intended to rank the states based on the percent of adult college enrollment for adult of 25 years old or older that had not obtained their first undergraduate degree. In this chart, we ignored the third number presented in the first chart just to keep the definition clearer and consider those third number exception cases. The second chart also display the 90% MOE, which represent the range of possible sampling errors.


Adult College Enrollment Rate with 90% MOE

The third chart presents the Adult College Enrollment Rate in the map format.
Adult College Enrollment Rate by States

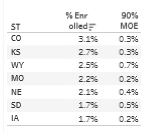
The forth chart provide the number in a table format and allows user to easily compare selected states. 
Table for Comparing Selected States

The following table lists all states in ranking order.

ST% Enrolled90% MOE
UT3.9%0.4%
HI3.8%0.6%
CA3.7%0.1%
DC3.6%1.0%
NM3.4%0.5%
AK3.4%0.8%
RI3.3%0.5%
WA3.2%0.2%
MD3.1%0.3%
CO3.1%0.3%
VA3.0%0.2%
AZ3.0%0.2%
OR3.0%0.3%
GA3.0%0.2%
NC2.9%0.2%
TX2.9%0.1%
NV2.8%0.3%
ID2.7%0.5%
DE2.7%0.6%
CT2.7%0.3%
KS2.7%0.3%
MN2.6%0.3%
MI2.6%0.2%
SC2.5%0.2%
WY2.5%0.7%
MA2.5%0.2%
FL2.5%0.1%
WI2.4%0.2%
NH2.4%0.4%
IL2.4%0.2%
LA2.4%0.2%
OH2.3%0.2%
NY2.3%0.1%
IN2.3%0.2%
OK2.2%0.3%
MO2.2%0.2%
AL2.1%0.2%
MT2.1%0.5%
NJ2.1%0.2%
NE2.1%0.4%
TN2.1%0.2%
MS2.0%0.3%
AR2.0%0.3%
ME2.0%0.4%
KY1.9%0.2%
ND1.9%0.8%
VT1.7%0.6%
SD1.7%0.5%
IA1.7%0.2%
PA1.6%0.1%
WV1.5%0.3%

Labels: , , , , , , ,

Thursday, February 23, 2017

Brain Drain - 2015 ACS State Migration for Working Age

Updated on Feb. 27, 2017:
An attempt has been made to rank states by brain drain indexes based on migration. See article Brain drain - ranking and analysis with 2015 ACS data.

As will be discussed in my upcoming article about various possible conception/perceptions about the idea of 'brain' in the context of 'brain drain', one of the definition or interpretation would be the education attainment of the workforce, hence, the age range of 22 to 64 years old.

As mentioned in my previous article: Population migration derived from ACS 2015 5-year PUMS dataset, I was in the process of producing a more detailed result from the ACS 2015 5-year PUMS dataset and here it is. For this article, we ignored the in-migration from foreign counties, which was included in the previous article. Time allowed, we will look into foreign country migration in details.

Basically, we look at all samples with age between 22 and 64 years old in the PUMS file along with each sample's education attainment level and the state of residing a year ago. By analyzing these data, we can estimate the number of people moving in and out of a state and with what kind of education attainment level.

It happened that I was attending a Tableau promotion meeting recently and decided to give it a try even though I would have preferred an open source solution, which I did try to look up, but did not have enough time to evaluate them yet.

The rest of this article will simply provide notes to the presentation since I have the baggage of an old IT worker that abbreviates almost everything.

First, the cite of the data source: ACS 2015-2011 5-year PUMS file processed by Dr. Duncan Hsu.

The Brain Drain Migration between states presentation can be found at Tableau Public and below are some of the summaries: 

The first tab/page/slide, "Map - Migrated to To_State", is the in-migration map for the state of interest specified by the right-hand side dropdown control: the To_State. The map will show the number of people moving from each state to the To_State, with the education attainment level you specified by the second dropdown list labeled EdAttnmnt. To see the numbers, hover your mouse above a state of interest. For example, the following chart show that there were 724 people moved from Kansas to Nebraska, which was selected as the 'To_State'. Possible values for the EdAttnmnet dropdown are: Less than High School Degree (LssHsDgr), High School Degree or Equivalent (HsDgrEqv), Some College Experience/Course-work but no degree (SomeCllg), Associate Degree (AssctDgr), Bachelor Degree (BchlrDgr), Master Degree (Mstr), First Professional Degree (FP), and Doctor's Degree (Drs).
In-Migration to Nebraska

The second tab, "Map - Migrated out From_State", is the out-migration map for the state of interest. Operational wise, this is very similar to the first tab. In the map below, it shows that there were 421 people migrated to Iowa from Nebraska, which was selected as the 'From_State'.
Out-Migration from Nebraska

The third tab, "Map - Net migration", shows the net migration. By hover over each state, it shows three numbers, the HdCnt (head count; negative for out-migration and positive for in-migration) and the upper and lower bound for the 90% confidence level. The dropdown to the right displays 6 education attainment levels with the Graduates (Grdts) encompassing  Master, First Professional, and Doctor's degree.
Net-Migration for Nebraska

The fourth tab, is the net migration bar chart for each state where the bar indicated the Margin of Error (MOE) at the 90% confidence level. Again, dropdowns are on the  right.
Net-Migration with 90% MOE

The fifth tab provides the data used in the fourth tab in table format with the upper and lower bound of the 90% MOE.
Net-Migration for Nebraska's neighboring states

The Sixth tab allows selecting states with the map.
Selecting States with Map

Labels: , , , , , , , , ,

Monday, January 30, 2017

Population migration derived from ACS 2015 5-year PUMS dataset


Now that we have got all the data imported, let's have some fun.

For those of you who knows me, I have been an advocate for open source movement for a while now. The statistic software I preferred to use have been the R. However, I had not spent a lot of my time on R - I think we all understand that people got a lot of things to do and we revisit a tool when we needed to.

Couple months ago, I spent my spare time and wrote quite a bit of code in R and I thought that I will be right at home when I decided to take on this migration project. Boy, am I wrong about this... gosh. Well, spent almost whole day and end up fixing some of the bugs - well, not really a bug but because I have decided to include the NA definition into my definition database, it caused some problem when referencing these definitions from my old code. Anyway, got it fixed but did not really use the R.

Well - my IT training kicked in - I realized that instead of using the statistic software for this project, a few SQL statement will largely simplify the task to nothing. Come to think about this, the SQL not only easier, it actually run much faster - Database is designed to run from hard disk, it is not like most statistic software will load all the data into memory and tied up the computer resources. By the way, a while back I have this idea of using database as my statistic software. I actually check out MS SQL documentation on customer functions and, do you know what, it is totally possible. Now, the question is who is going to take on this project.

Anyway, I end up running few SQL statements and dumping it into Excel with a bunch of formula - sorry, I haven't really invested in the Open Office yet.

OK. Let's get back to the topic. American Community Survey is conducted by US Census Bureau in an annually basis. The PUMS file is sampled from the collected data and allows user to use these sample to derive results that weren't readily tabulated by the US Census Bureau.

Inside the ACS survey, there is a question that asked respondents where they lived a year ago. Based on this question, we can look into the PUMS data and derive some useful information from it. One of the interesting application of this question is when it is combined with the education attainment info of the respondents. This allowed data analysts to see that, for people moving out of a state, what kind of education these people acquired and, hence, the brain drain if highly educated people left a state.

Click here for the resulting file - please noted that for any result derived from sampling, there are associated errors - this file does not come with the 'margin of errors', which describes the range the real value may lie. In our case, with large enough margin of errors, the real value for an in-migration could end up in negative and, hence, associated with the idea of  an out-migration. So, the file is for references only. The author is working on consolidate some of the categories and, hopefully, can report some data with reasonable 'margin of error'.


Labels: , , , , , , ,

Wednesday, January 25, 2017

ACS 2015 5-year PUMS for database/IT professional

Continue with the ACS PUMS database project, the task is to import the 5-year ACS PUMS product of 2015.

Comparing Census's 2015 Data Dictionary file (PUMS_Data_Dictionary_2011-2015.txt) to that of 2014, we, again, noticed that Census' added leading spaces to a lot of lines to, possibly, make the file more readable for 'human' users. Following the step of processing the 2015 1-year file, I removed those leading spaces via sed before processing it with my definition processor.

Processing the Data Dictionary file with my program, it yields the following parsing errors. Some of them are clearly unintended errors, others may just because Census did not spend time and efforts to establish clear syntax rules so that their products can be machine friendly. Here are the parsing errors:


      ADJINC
        value 1001264, the blank after '1001264' is actually an A0h instead of
          20h.
      TEN
        just before TEN, a two line 'NOTE:'
      PERSON RECORD
        - no blank line after the 'PERSON RECORD' section mark
      ADJINC
        value 100264, the blank after '1001264' is actually an A0h instead of
          20h.
      GCL
        just before GCL, a two line 'NOTE:'
      FPINCP
        no empty line before FPINCP


The A0h one is really interesting. For those of interest, A0h is a NBSP character used in HTML. Without a good hex editor, it takes me a lot of efforts to figure out what is going wrong.


Labels: , , , ,