Education Enrollment and Adult College Enrollment by Age - 2016 ACS
In my previous article, we look at the total adult college enrollment for each state. In this, I would like to take one step further to look into the enrollment by age. In this article, ages are presented in an interval of 3. An age label of 25 is actually the sum of age 24, 25, and 26.
Again, the analysis is post on my public tableau website.
The first chart presents few basic numbers that provided background information for discussion. In the chart, the variable zTtl represents the total population. When select all states, the Millennial's bump at age 25 can clearly be seen. The curve zAttnmntUndr+ represent all people with education attainment of undergraduate degree (associate or bachelor) or above. As shown in the chart, the curve first take a large gain at age 25 when most college students obtained their undergraduate degrees. The curve then peaked at age 31 when few more students finishing their undergraduate degrees and others obtained their graduate degrees. However, keep in mind that, in this age chart, the total population trend also contributes.
The line zAttnmntNoCllgDgr represents the number of people do not obtained undergraduate degree or above. As can be seen in the chart, the line begins to drop once students begin to obtain their undergraduate degrees. Again, keep in mind, the population trend has its effect as show in the bump around age 55, where, due to the population bump, the population do not have college degree also show a bump. The remaining two green-blueish lines display the college undergraduate (zEnrllUndr) and graduate (zEnrllGrdt) enrollment. These two lines peaked at age 19 and 25 respectively.
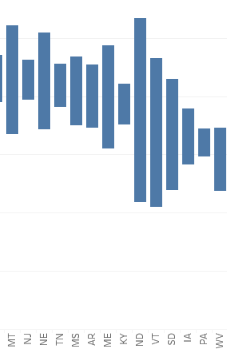
The second chart provide basic information on college-education attainment by age for each state. The variable zpctAttnmntUndr+ shows the percent of population obtained undergraduate degree and above. With all states selected, the United States shows a highest rate of 46% at the age of 34. The other two lines on this chart, zpctAttnmntUndr and zpctAttnmntGrdt, represent the percent of population with the highest degree attainment of undergraduate or graduate degrees.
The third chart displays two education attainment lines from the first chart (zAttnmntUndr+, and zAttnmntNoCllgDgr) along with a college enrollment line (zNoUndrEnrllUndr+). The college enrollment line counts all students enrolled in both undergraduate and graduate but haven't obtain an undergraduate degree yet. By taking the ratio of zNoUndrEnrllUndr+ against zAttnmntNoCllgDgr we arrived at the forth chart.
As mentioned above, the forth chart display the ratio between zNoUndrEnrllUndr+ and zAttnmntNoCllgDgr. It shows the fraction of non-college degree earner enrolled in college classes. Conferred to chart three, since at the age of 18, 19, and 20, there were relatively few people (313,517) obtained college degrees, the peak at the age 19 shows that, in US, about 50% of that age group went to college. Also observed on the chart is that, after the peak, the percentage of non-college-degree bearer enrolled in college decreased monotonically. Meaning that the older the people are, the less likely they will enrolled as an adult student. For Adult college enrollment at age 25 (aggregates age 24,25, and 26), the rate are about 15% nationally, and dropped fast to 9% at age 28 ( aggregates 27, 28, and 29).
Again, the analysis is post on my public tableau website.
The first chart presents few basic numbers that provided background information for discussion. In the chart, the variable zTtl represents the total population. When select all states, the Millennial's bump at age 25 can clearly be seen. The curve zAttnmntUndr+ represent all people with education attainment of undergraduate degree (associate or bachelor) or above. As shown in the chart, the curve first take a large gain at age 25 when most college students obtained their undergraduate degrees. The curve then peaked at age 31 when few more students finishing their undergraduate degrees and others obtained their graduate degrees. However, keep in mind that, in this age chart, the total population trend also contributes.
 |
| Education Attainment and Enrollment by Age - United States ACS 2016 |
The line zAttnmntNoCllgDgr represents the number of people do not obtained undergraduate degree or above. As can be seen in the chart, the line begins to drop once students begin to obtain their undergraduate degrees. Again, keep in mind, the population trend has its effect as show in the bump around age 55, where, due to the population bump, the population do not have college degree also show a bump. The remaining two green-blueish lines display the college undergraduate (zEnrllUndr) and graduate (zEnrllGrdt) enrollment. These two lines peaked at age 19 and 25 respectively.
The second chart provide basic information on college-education attainment by age for each state. The variable zpctAttnmntUndr+ shows the percent of population obtained undergraduate degree and above. With all states selected, the United States shows a highest rate of 46% at the age of 34. The other two lines on this chart, zpctAttnmntUndr and zpctAttnmntGrdt, represent the percent of population with the highest degree attainment of undergraduate or graduate degrees.
 |
| Education Attainment By Age - United States ACS 2016 |
The third chart displays two education attainment lines from the first chart (zAttnmntUndr+, and zAttnmntNoCllgDgr) along with a college enrollment line (zNoUndrEnrllUndr+). The college enrollment line counts all students enrolled in both undergraduate and graduate but haven't obtain an undergraduate degree yet. By taking the ratio of zNoUndrEnrllUndr+ against zAttnmntNoCllgDgr we arrived at the forth chart.
 |
| Education Attainment and Enrollment By Age - United States ACS 2016 |
As mentioned above, the forth chart display the ratio between zNoUndrEnrllUndr+ and zAttnmntNoCllgDgr. It shows the fraction of non-college degree earner enrolled in college classes. Conferred to chart three, since at the age of 18, 19, and 20, there were relatively few people (313,517) obtained college degrees, the peak at the age 19 shows that, in US, about 50% of that age group went to college. Also observed on the chart is that, after the peak, the percentage of non-college-degree bearer enrolled in college decreased monotonically. Meaning that the older the people are, the less likely they will enrolled as an adult student. For Adult college enrollment at age 25 (aggregates age 24,25, and 26), the rate are about 15% nationally, and dropped fast to 9% at age 28 ( aggregates 27, 28, and 29).
 |
| Non-Degree Bearer Enrollment By Age - United States ACS 2016 |
Labels: ACS, adult, age, American, attainment, college, education, enrollment, states, United State
posted by Duncan @ 5:12 AM
0 Comments
![]()