A Look At the Adult College Enrollment by State - 2016 ACS
After importing the ACS (American Community Survey) 2016 1-Year PUMS (Public Use Micro Sample) data, the question is what come next? Just holding to sets of data doesn't do anyone any good except taking up disk spaces - in this case, it takes about 2.9GB including both the personal and housing unit data.
With the push of Obama's call for increasing college attainment of 60% by 2020, the adult college enrollment can be an important factor. * Obama, however, did not limited his view to associated degree and above. Researchers have been trying to include all sorts of certificates on their way to compare to the 60% goal.
In this article, we try to measure what percentage of the adult who had not obtained an undergraduate degree is enrolled in college. We defined the adult as anyone who is 25 years old or older. This approach, basically give the traditional high school graduates 6 years to obtain their undergraduate degree before been considered in our measure.
As would be presented in a separate article, our definition of 'adult college enrollment' may not match that mental picture of some of our readers since some reader may only consider individuals that rejoin the college after years of absent as the 'adult college enrollment'. While with our definition, traditional students taking longer than 6 years to obtain their first college are included.
Our result of processing the 2016 ACS 1-Year PUMS is presented at Tableau's public use web site.
In the first chart, we presented three numbers that were used for each state. The first number, NoUndrDgr, is the number of adults 25 years old or older that did not obtained an undergraduate degree (associates or bachelor) yet.The second number, WorkOnUndrDgr, for a state is the number of adults that were defined in the first number that are enrolled in undergraduate college programs. The third number, WorkOnGrdtDgr, for a state is the number of adult that were defined in the first number that are enrolled in college graduate program. Even though traditional wisdom doesn't think the third number is possible, for some states these numbers are perceivable. One possible case is due to medical schools. Because some medical school only require appropriate undergraduate course work and standard testing results to be qualified as applicants, it become possible for these students to enrolled in graduate medical program before obtaining bachelor degree. The other possibilities become possible since some colleges begin to thread bachelor degree and the graduate degree together so that students are enrolled for graduate degree while work toward finishing up bachelor degree with courses that credited for both degree. There were cases, the students will be awarded both degree at the end of the program and resulting graduate school enrollment before finishing up bachelor degree.
In the second chart we present the percent of students who were 25 years old or older that had no received an undergraduate degree that are enrolled in college undergraduate program. The chart is intended to rank the states based on the percent of adult college enrollment for adult of 25 years old or older that had not obtained their first undergraduate degree. In this chart, we ignored the third number presented in the first chart just to keep the definition clearer and consider those third number exception cases. The second chart also display the 90% MOE, which represent the range of possible sampling errors.
The third chart presents the Adult College Enrollment Rate in the map format.
The forth chart provide the number in a table format and allows user to easily compare selected states.
The following table lists all states in ranking order.
With the push of Obama's call for increasing college attainment of 60% by 2020, the adult college enrollment can be an important factor. * Obama, however, did not limited his view to associated degree and above. Researchers have been trying to include all sorts of certificates on their way to compare to the 60% goal.
In this article, we try to measure what percentage of the adult who had not obtained an undergraduate degree is enrolled in college. We defined the adult as anyone who is 25 years old or older. This approach, basically give the traditional high school graduates 6 years to obtain their undergraduate degree before been considered in our measure.
As would be presented in a separate article, our definition of 'adult college enrollment' may not match that mental picture of some of our readers since some reader may only consider individuals that rejoin the college after years of absent as the 'adult college enrollment'. While with our definition, traditional students taking longer than 6 years to obtain their first college are included.
Our result of processing the 2016 ACS 1-Year PUMS is presented at Tableau's public use web site.
In the first chart, we presented three numbers that were used for each state. The first number, NoUndrDgr, is the number of adults 25 years old or older that did not obtained an undergraduate degree (associates or bachelor) yet.The second number, WorkOnUndrDgr, for a state is the number of adults that were defined in the first number that are enrolled in undergraduate college programs. The third number, WorkOnGrdtDgr, for a state is the number of adult that were defined in the first number that are enrolled in college graduate program. Even though traditional wisdom doesn't think the third number is possible, for some states these numbers are perceivable. One possible case is due to medical schools. Because some medical school only require appropriate undergraduate course work and standard testing results to be qualified as applicants, it become possible for these students to enrolled in graduate medical program before obtaining bachelor degree. The other possibilities become possible since some colleges begin to thread bachelor degree and the graduate degree together so that students are enrolled for graduate degree while work toward finishing up bachelor degree with courses that credited for both degree. There were cases, the students will be awarded both degree at the end of the program and resulting graduate school enrollment before finishing up bachelor degree.
 |
| The Number for Adult College Enrollment |
In the second chart we present the percent of students who were 25 years old or older that had no received an undergraduate degree that are enrolled in college undergraduate program. The chart is intended to rank the states based on the percent of adult college enrollment for adult of 25 years old or older that had not obtained their first undergraduate degree. In this chart, we ignored the third number presented in the first chart just to keep the definition clearer and consider those third number exception cases. The second chart also display the 90% MOE, which represent the range of possible sampling errors.
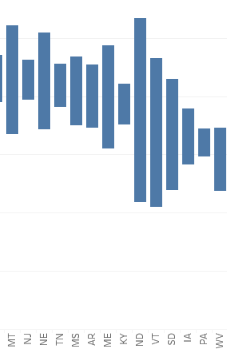 |
| Adult College Enrollment Rate with 90% MOE |
The third chart presents the Adult College Enrollment Rate in the map format.
 |
| Adult College Enrollment Rate by States |
The forth chart provide the number in a table format and allows user to easily compare selected states.
 |
| Table for Comparing Selected States |
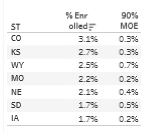
The following table lists all states in ranking order.
| ST | % Enrolled | 90% MOE |
|---|---|---|
| UT | 3.9% | 0.4% |
| HI | 3.8% | 0.6% |
| CA | 3.7% | 0.1% |
| DC | 3.6% | 1.0% |
| NM | 3.4% | 0.5% |
| AK | 3.4% | 0.8% |
| RI | 3.3% | 0.5% |
| WA | 3.2% | 0.2% |
| MD | 3.1% | 0.3% |
| CO | 3.1% | 0.3% |
| VA | 3.0% | 0.2% |
| AZ | 3.0% | 0.2% |
| OR | 3.0% | 0.3% |
| GA | 3.0% | 0.2% |
| NC | 2.9% | 0.2% |
| TX | 2.9% | 0.1% |
| NV | 2.8% | 0.3% |
| ID | 2.7% | 0.5% |
| DE | 2.7% | 0.6% |
| CT | 2.7% | 0.3% |
| KS | 2.7% | 0.3% |
| MN | 2.6% | 0.3% |
| MI | 2.6% | 0.2% |
| SC | 2.5% | 0.2% |
| WY | 2.5% | 0.7% |
| MA | 2.5% | 0.2% |
| FL | 2.5% | 0.1% |
| WI | 2.4% | 0.2% |
| NH | 2.4% | 0.4% |
| IL | 2.4% | 0.2% |
| LA | 2.4% | 0.2% |
| OH | 2.3% | 0.2% |
| NY | 2.3% | 0.1% |
| IN | 2.3% | 0.2% |
| OK | 2.2% | 0.3% |
| MO | 2.2% | 0.2% |
| AL | 2.1% | 0.2% |
| MT | 2.1% | 0.5% |
| NJ | 2.1% | 0.2% |
| NE | 2.1% | 0.4% |
| TN | 2.1% | 0.2% |
| MS | 2.0% | 0.3% |
| AR | 2.0% | 0.3% |
| ME | 2.0% | 0.4% |
| KY | 1.9% | 0.2% |
| ND | 1.9% | 0.8% |
| VT | 1.7% | 0.6% |
| SD | 1.7% | 0.5% |
| IA | 1.7% | 0.2% |
| PA | 1.6% | 0.1% |
| WV | 1.5% | 0.3% |
Labels: ACS, adult, college, enrollment, graduate, PUMS, rank, undergraduate
posted by Duncan @ 8:56 AM
![]()

0 Comments:
Post a Comment
Subscribe to Post Comments [Atom]
<< Home